Creating with ICT
Subject/Year Level: Science/Year 2
Topic: Biological Sciences
Learning Goal: Observing and understanding the characteristics involved in the growth of animals and their different life stages.
http://www.australiancurriculum.edu.au/science/Curriculum/F-10#cdcode=ACSIS026&level=1
Title: Life cycles: Whales
Category: Creating with ICT
Screenshots:
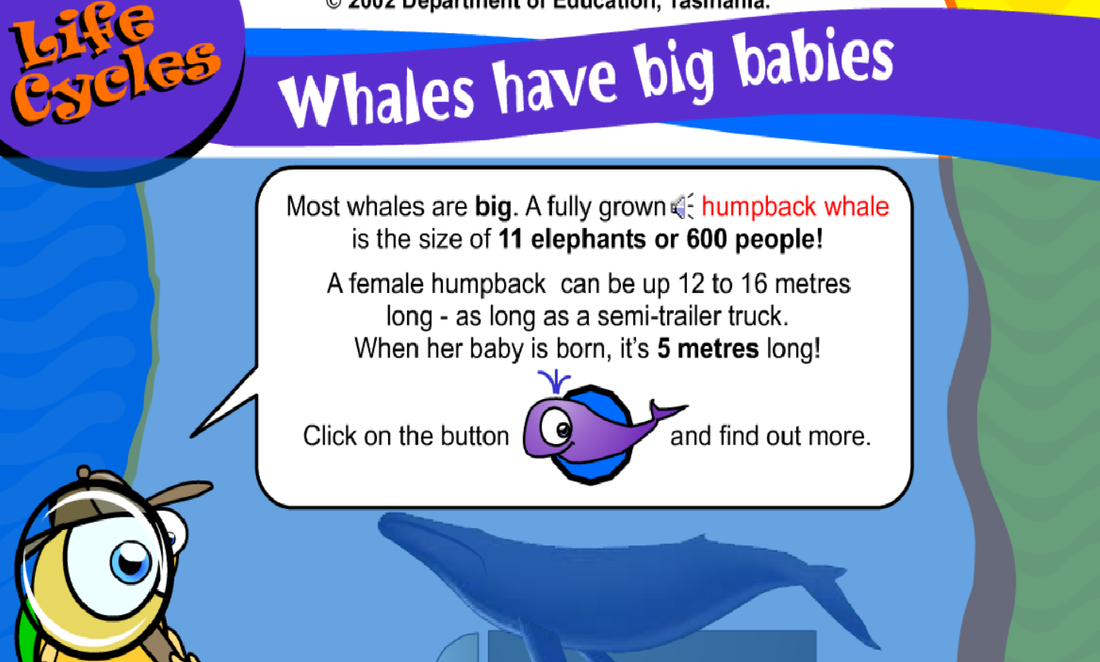
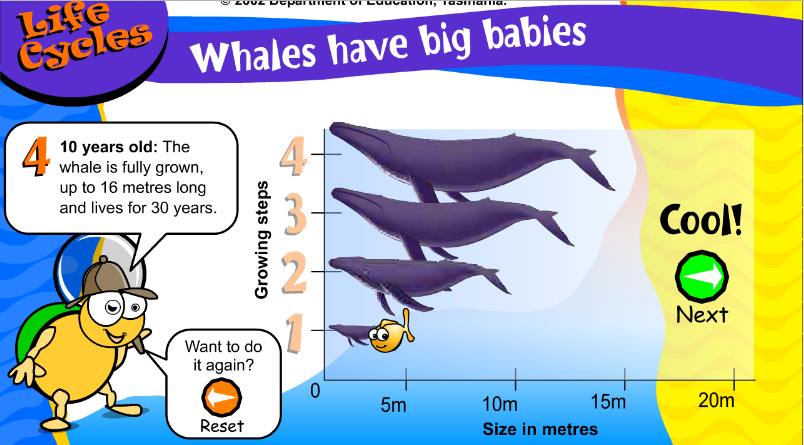
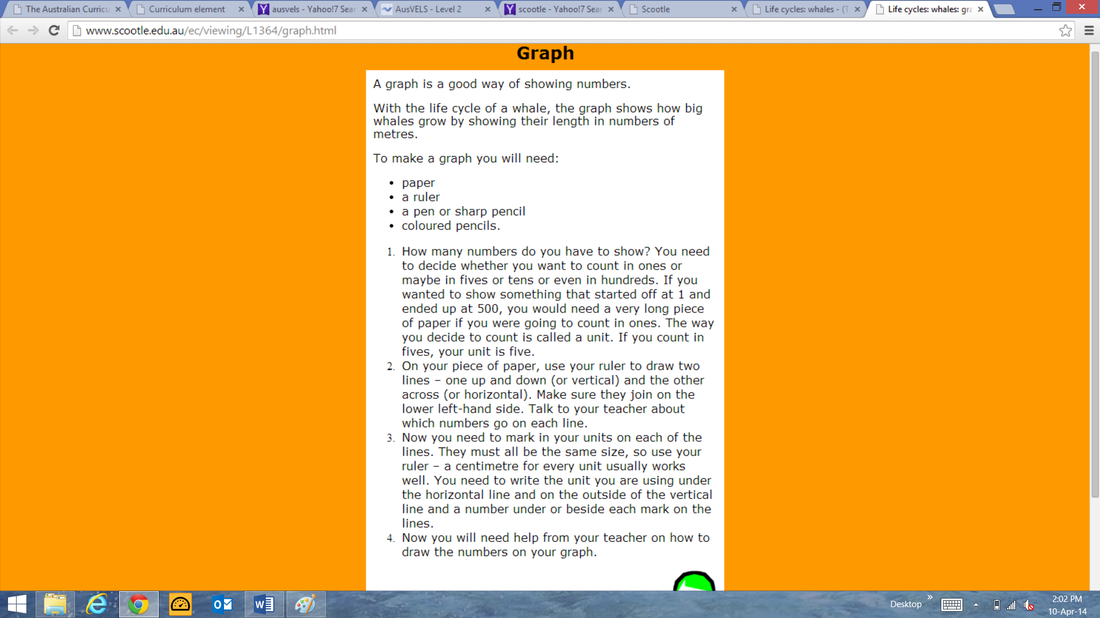
Description: It is packaged as a combined learning object that illustrates the growth and features of a whale as it grows from a baby whale up until an adult whale. When you first open the learning object, it gives you some background information on how big a fully grown whale is as opposed to a female humpback. You can then click on a series of links which are labelled " find out more" which provides you with further information about the growing steps of a whale in relation to its size. The application provides you with one more step which sets out instructions ( as indicated in screenshot number 3) on how to create your own graph of the growth of a different animal. It outlines step by step instructions on how to construct this using materials such as paper, ruler, pen and coloured pencils. http://www.scootle.edu.au/ec/viewing/L1364/index.html
The strategies to achieve the learning goal: The aim of this learning object is to help students in their understanding of how to graph the growth of an animal. By the end of this task, students should be able to generate ideas, plans and process by experimenting with creative tools through this learning object. They should also be able to generate basic data representations which graphically represent their knowledge of the learning goal; Observing and understanding the characteristics involved in the growth of animals and their different life stages. Whilst this learning object sorely focuses on the growth of a whale, the second stage of the learning object encourages students to expand on their knowledge and research the life stages of another animal. The strategy behind this is to encourage students to expand on their own ideas and knowledge in which they have just learned by applying those same skills of drawing the lifespan of a whale to drawing a lifespan of a different animals. It also allows students to gain awareness and display sequences of long term events so they can relate back to these skills in the future.
Throughout the creation of this learning object, students should be able to draw simple growth charts of a range of animals and generate other data presentations for particular audiences and purposes. By experimenting with this type of ICT as a creative tool will also help them to create simple solutions, modifications in these presentations. They should be able to grasp the correct knowledge to find solutions or answers to questions such as "how large is an average adult humpback whale?". At the end of this task, students should be able to strategically represent the acquired data of these animals in numerical and graphical data and edit the works of their own and others.
